Monday, April 3, 2023

ProteoCool Pills#25: Choice of the right material is essential to perform DNA and/or protein UV Spectrophotometric quantifications

 As already reported in the ProteoCool Pills#13, and ProteoCool Pills #24 several different methods are currently available to perform quantification of purified DNA fragments and plasmid as well as recombinant proteins and antibodies.

One simple method common to both, DNA and protein quantification is the spectrophotometric determination in the UV range (260nm for DNA and RNA and 280nm for proteins and monoclonal antibodies)

Spectrophotometric quantification has several advantages:

 - Cheap (do not require any specific reagent);

-  Fast (do not require sample pre-incubations);

Non-destructive (the sample could be recovered);

The main drawback that limits in the past the use of the UV quantification was the fact that standard glass and standard plastic absorbs strongly in UV region and the quartz cuvettes were necessary to perform protein (280nm) and DNA (260nm) quantification.

Quarts cuvettes work well in both UV and visible regions (right from 190 nm) but are expensive, fragile and time consuming, because not disposable and therefore it need to be carefully washed between the different samples.

Of course the same limitation is applicable also to the multiplate reader, because the standard plastic bottom plates cannot be used for measurements in <300-320 nm due to the plastic absorbance.

Solutions:

1) Use a microvolume UV-Vis spectrophotometers (eg Nanodrop) that do not require any specific support (plate or cuvette):

  Pros:

 Low sample volume (2 µl)

 Fast

      Simple

       Cons:

          Less sensitive than cuvettes because the optical path is 1mm instead 10mM of the cuvettes

  Lambert-beer law à  Abs=ebc where b is the optical path

For the same sample e= constant à 1/10 of optical path à 1/10 of Abs at the same c (concentration)

 Need to be carefully cleaned (protein buffers are rich of salt and the surface properties of the pedestals can be compromised and the samples drop Flattens out and the read are not reproducible

       2) Use Plastic UV-Cuvette or  UVclear multiplates:

In the recent years special plastic compounds with low absorbance at wavelength >220nm were developed:

In this post I would like just to provide some example of comparision of background Abs260 and Abs280 signal obtained with standard and UV-transparent plastic matherial:


In conclusion, expecially for DNA determination, standard plastic cuvette and multiwell plates cannot be used. The UV transparent plastics represent a nice, cheaper alternative to quartz cuvette. If it is true that those support are little more expensive than the corresponding made by standard plastic matherial, it is also true that in the most of the cases, after carefull washing with milliQ water and ethanol20%  can be re-used many times. 


Thursday, March 9, 2023

ProteoCool pills#24: Rapid fluorimetric DNA plasmid quantification on 96 welll plate

One of the most common methods for nucleic acid detection and quantification is the measurement of solution absorbance at 260 nm (A260) due to the fact that nucleic acids have an absorption maximum at this UV wavelength

When DNA is present in the sample a fraction of the ultraviolet light will pass through and an other fraction will be absorbed and the amount of the light absorbed is directly proportional to the nucleic acid concentration in the sample. Using the Beer-Lambert Law it is possible to relate the amount of light absorbed to the concentration of the absorbing molecule.

At a wavelength of 260nm, the average extinction coefficient is:

-        0.020 (μg/ml)−1cm−1, double-stranded DNA;

-        0.027 (μg/ml)−1 cm−1, for single-stranded DNA 

Spectrophotometric quantification is precise and with the advent of microvolume spectrophotometer (e.g  nanodrop) those allow to perform measurement using very small sample volumes (1-2ul) with-out the use of any sample support (e.g quartz cuvette)  it become the method of first choice for DNA plasmid quantification in the molecular biology laboratories.

DNA quantification with microvolume spectrophotometer is precise and allow to evaluate DNA purity and RNA but it is time consuming  (20-30’’ for sample) and therefore not applicable to the measurement of a huge number of samples in parallel.

Modern HT (High throughput) cloning platforms produce hundreds of DNA samples (plasmidic ans/or genomic) in parallel and using a multiwell based approach is certainly preferable to speed up the process. 

Since multiwell determination require at least 50-100 ul of  sample/well,  a preliminary sample dilution step is required to do not use the entire DNA sample for this step, but this may represent a problem, since the method sensitivity is limited.

For example: 

- If we consider that A(260)=0.1 using a spectrophotometer with 1 cm of optical path-lenght correspond to a dna sample with concentration of 5ng/ul. 

Generally the path-length in a multiwell plates is lower than 1cm 

For example 100ul of an half area UVclear 96 well plate result on a path length of about 0,67cm  (A(260)=0,1 with a 7,5ng/ul sample)

Therefore if we dilute 10ul of our MINI PREP to 100ul final and we read the ABS280 on a multiplate reader we will obtain a  detectable ABS (>0,1) only for samples with concentration >75ng/ul that is too high since in my experience the range of plasmid concentrations that are generally obtained with a 96 well plate mini kit is in the range 20-100ng/ul. 

In this post I would like to show you as using a common Fluorimetric stains  (in my case Lonza Gel Star) developed to bind DNA staining in agarose gel a rapid DNA quantification could be performed in 96 well plate format. 

Example:

DNA plasmidic quantification using Gel Star probe (Lonza)

2ul DNA sample in 100ul Gelstar stain diluted 10000 times (1X final concentration) in H2O 

plates: 96 well flat black (Greiner)


Instrument: multiplate reader (Tecan M200)   Ex:490nm; Em:530mn (gain:80)

A standard curve was built using an available commercial plasmid pRSET/BFP (Invitrogen) and serial dilution were performed to obtain a final DNA concentration range (2,5- 0,0025ug/ml) 


The fluorimetric methods using GelStar show linearity in a concentration range 0,01ng/ul to 0,625ng/ul.

Therefore the methods, using 2ul of dna sample (dilute in 100 of probe) could be direclty applied to the quantification of DNA samples in concentration range 0,5-30 ng/ul that is in the range of the sample that normally are obtained for 96-well mini kit dna preparation kit.

In case that DNA samples are more concentrated we can simple reduce the DNA volumes  (to 1ul or 0,5ul) used for the test.

Considering that fluorescence of the probe can depend from DNA size and origin (single or double strand) is it ever suggested to perform a calibration line with a standard DNA sample with similar size and origin respect the ones that we would like to quantify.

Of course differently to 260/280 nm quantification this methods do not allow to you to estimate sample purifity )in terms of protiens) or buffer contamination but i'm my opinion modern mini kits are quite reilable and in 99% of cases the sample quality is ok for the downstream applications (eg sequencing, E.coli trasformation)

In my experience, this method is very usefull to rapid quantification of high number of purified plasmid to use for sequencing, trasformation and protein expression. 

I have done those trials with GelStar probe since it was the one avaialble in my lab at the time of this test but i suppose that similar results can be obtained also with other simiilar probes (eg, Gelred, midori green, Sybr safe it the right Ex/Em wavelenght were selected. Since each probe is chatacterized from a different fluoresence quantum yielad is possible that a different probe may affect a little the limit of sensitivity. 

Please, DO NOT USE Ethidium Bromide!!

Fortunatelly today,  less toxic probes (as i already mentioned in the ProteoCool Pills n°4) with similar sentitivity and low cost are avaialble. 


Wednesday, February 1, 2023

ProteoCool Pills #23: Selection of the right post-coloumn filter is essential to detect protein/antibody aggregates in static light scattering

Static light scattering (SLS) is a technique to measure absolute molecular weight using the relationship between the intensity of light scattered by a molecule and its molecular weight and size. 

Some SLS technologies exist: multiangle light scattering (MALS), right-angle light scattering (RALS), low-angle light scattering (LALS) and RALS/LALS hybrid systems 

MALS or RALS/LALS when coupled with other detectors (eg UV-vis, RI, densitometry, fluorimeter) in an advanced GPC-SEC system can be applied to investigate solution properties, stability testing and process development for different kind of  conjugated and unconjugateed biologics

Light scattering detectors (low-angle LALS, right-angle RALS, or multi-angle MALS) are very sensitive to the presence of particulates, when those are used for molecular weight detection in chromatography. Unfortuantelly even the best  columns can shed some particulates from their packing material. Although undetected by most conventional detectors, such as UV and RI, these particles scatter significant amounts of light, produce noise that affect the light scattering signals and baselines. To mitigate this, the MALS, LALS/RALS sistems include an in-line coloumn filter that can significantly improve the quality and thus the accuracy of both the data and results.

In this post i would like to share with you some data acquired loading different mabs in a Cytiva Supedex200 increase 10/30 coloumn in the OMNISEC instrument equiped wih the LALS/RALS detector in the presence/absence of post coloumn filter. 

First of all we compared the baseline signals that can be obtained 

- Without filter;

- With a 0,2um nylon filter;

- With 0,2um cellulose filter; 


The baseline signals suggest that nylon filter is the best in terms of signal/noise ratio 

Is it really the best choiche for analisys of protein/antibody preparations? 

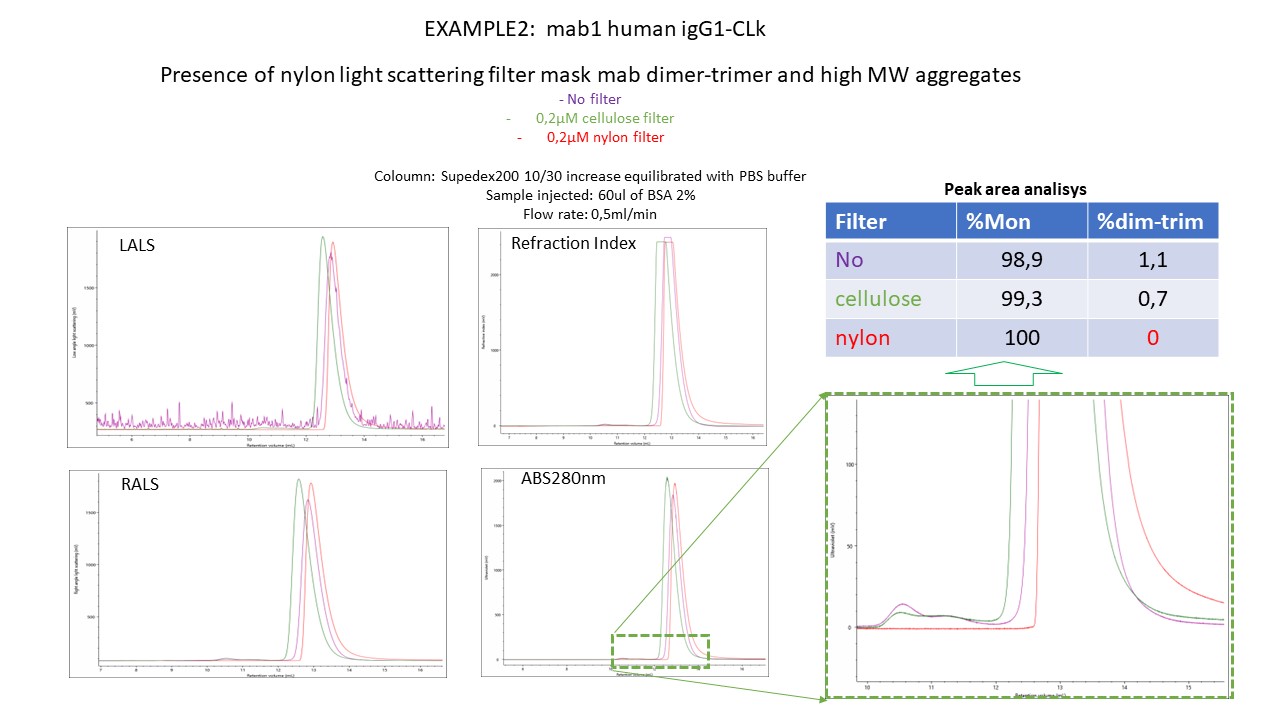
To assess it, a 2% BSA standard and 2 different purified monoclonal antibodies (igG1 human) were loaded in the superdex200 10/30 increase coloumn and analized with the OMNISEC instrumentation  


In all the 3 cases, the Nylon filter guarantee the best signal/noise ratio at LALS but it seems to mask the presence of a significant fraction of high molecular weight proteins.

This was most evident for the mabs, since the dimeric-trimeric and MW aggregates were not detected, even if at UV and RI, using the nylon filter.

ThIs differences may lead to overtimating the quality of a certain mab or protein preparation and it can lead to false positive results in case of stability studies that  would like investigate the mab/protein aggregation propensity under stress (as acid pH, 37°C, freeze/thaw)

For this kind of studies cellulose filter seem to be the best compromise between quality of LALS signal and recovery of the protein polimers. 

As a general comment: Often the diffence is in the details! It is important be able to critically review the Positive results to distinguish the real positives than false positives! 

Suggested links: 

https://www.materials-talks.com/how-to-change-the-light-scattering-post-column-filter-membrane/


Friday, January 13, 2023

ProteoCool Pills#22: Tips for cleaning the OMNISEC RALS/LALS flow cell if get dirty after the passage of biological samples


                                                                           OMNISEC 

is an advanced GPC/SEC system combining a pump, degasser, autosampler for mobile phase delivery and sample injection module with an integrated multi detector incorporating refractive index, UV/Vis, light scattering and viscosity detectors.

I have used the OMNISEC system to analyze the aggregation state of several biological samples (eg. recombinant antibody/protein preparations) in standard Phospate, MES or Tris buffers (pH range 5.5-8).

I found amazing the performances of the OMNISEC RESOLVE module, that thanks to the presence of a temperature controlled Autosampler (4oC – 60oC), allow to load in reproducible way an high number of samples and guarantee a very good throughput.

One of the main drawbacks (which i'm not sure if is it is common or not to other light scattering systems) that i found is the high tendency of the LALS detector to get dirty after the passage of some biological samples.

In this post i would like to share with you my experience about the cleaning procedure to use when you  see a strong increase of the LALS baseline signal after the passage of biological samples.

For example in the following video yoo can see the baseline LALS signal that was detected some months ago after the run of about 20 mab samples in a SEC coloumn (all the mabs were expressed from ExpiCHO cells, purified with MAbselect resin and buffer exchanged in PBS by desalting) :

If the RALS signal is not much higher than the optimal (aobut 80mV), the LALS signal was very high (optimal range is 200-300mV) and a cleaning procedure was required.

Since we do not observe any improvement (data not shown) from the passage of any routine cleaning solutions (methanol 10%, acetonitrile 10%, sodium azide 0,02%) suggested on pag106 OMNISEC SYSYEM Basic Guide manual provided with the instrument, we then decided to proceed with Deep cleaning (pag.105) using a 5% HNO3 solution:

        BUT UNFORTUNATELLY WE OBSERVE ONLY A WEAK REDUCTION IN THE LALS BASELINES SIGNAL

we than tested SDS (1% solution) which may be able to resuspend and remove protein aggregates/precipitate:

BUT UNFORTUNATELLY  ALSO IN THIS CASE WE DO NOT OBSERVE A REDUCTION IN THE LALS BASELINES SIGNAL

Finally we tested NAOH 0,1M solution, which is routinelly used for the cleaning of  several chromatographic resins  used for biologic purification  (e,g proteinA, proteinG, sepharose)


NAOH 0,1M works very well 
and restore the LALS BASELINES SIGNAL in the optimal range

 Thanks a lot to 

 Mirco Toccafondi 


Monday, November 7, 2022

ProteoCool Pills#21: Chromas a free tool to check your Sanger sequencing results

In the last 20 years several different software packages able to support the scientist in their molecular cloning activities  (e.g primer desing, sequence assembly, transaltiion, vector desing  desing to manipulate DNA and protein sequences  as CloneManager, SnapGeneVectorNTI (discontinued by Thermo from 2019)

Those software are fully integrated set of tools for e cloning simulation, graphic map drawing, primer design and analysis. They are charaterized by a huge number of functions and they require the payment of a licence. 

Are those advanced softwares striclty necessary for a molecular biologist that would like just to check the result of a gene cloning into a mammalian or bacterial expression vector ?

In my opinion NO! 

Those softwares could be certanilly useful (for example to map the primer annealing region, to desing the vector map) but not essential expecially if you have to produce a limited number of clones in parallel.

For example, in this post i would like to present youm  Chromas, which  is a free simple, easy-to-use sequence viewer and editor (able to open chromatogram files(.ab1) produced from automated Sanger sequencers) that could be used to check your sequencing results.

7A. Allign the Chormas sequence with the “Theoretical” DNA template 
or 
7B. Translate the sequence in AA format 
 (Generally I’m using the Translate Tool available at the Expasy web server) 
and allign the translated sequence with the “theoretical AA” template

If the sequence show some point mutation or shift, do not  discard the clone but check carefully the chromatogram to see if the mutation/shift is real or is it due to a non-correct Chromas assignment that may happen in case of:
-  overlapping peaks:
- peak with low intensity;
- a sequence regions with multiple residues of the same species;
  
Other similar softwares:


Sunday, October 9, 2022

ProteoCool Pills#20: Micro PEG solubility screening, a simple Tool for Biologics Design and Formulation Development.

Adequate protein solubility is an important prerequisite for development, manufacture, and administration of biotherapeutic drug candidates, especially for high-concentration protein formulations. 

For example, in monoclonal antibody discovery, early identification of monoclonal antibody candidates whose development, as high concentration (≥100 mg/mL) drug products, could prove challenging, due to self-interaction that may induce high viscosity, can help define strategies for candidate engineering and selection.

If in theory, Rheology measurements are an effective means for characterizing therapeutic protein/antibody solutions, practically, the conventional measurements are hindered by the limited amount of material, especially during early development, when it is necessary to screen and compare several different molecules over a wide range of conditions (e.g different pH, additives, concentration)

Therefore alternative techniques able to provide hints about aggregation propensity and solubility using a smaller sample volume are essential to compare and select the best candidates in the early development and reduce the risk of move forward an candidate with high developability risk. 

Dynamic light Scattering (DLS) is probably the most used technique for this purpose since it allows to:

1) Characterize the sample intermolecular interactions (attractive or repulsive?) comparing how the diffusion coefficient (Dt) is affected by concentration since: 

In an ideal dilute solution, the diffusion coefficient (Dt) measured by DLS is not dependent on solute concentration. As concentration increases, the solution becomes less ideal. 

           Dt=D0(1+kD*C)

Attractive interactions (kD < 0) cause an apparent decrease in Dt and an apparent increase in Rh, while repulsive interactions (kD > 0) cause an apparent increase in Dt and an apparent decrease in Rh 

Therefore, decrease of Dt in function of the concentration, indicating the presence of repulsive intermolecular interactions while increase of Dt in function of the concentration, indicate presence of attractive interactions (sample more prone to aggregation)

2) Perform viscosity assessment by Microrheology: Using polystyrene beads with known values of R allows for the determination of the viscosity of the protein solution that the beads are suspended in. The size of the beads is larger than that of the protein molecules, and thus the DLS signals can easily be separated.

Bilayer interferometry (BLI) was also recently proposed as an alternative to DLS to assess protein self-interaction. (Sun et.al mabs 2013Domnowsky et. al International Journal of Pharmaceutics 2020

All those methods are fast and require a small amount of material but they require specific and expensive instrumentations those are not present in all the laboratories.

In this post, I would like to introduce you a simple method that could be done in every laboratory (since it requires the presence of a centrifuge for plates and nanodrop UV spectrophotometer or similar) based on PEG precipitation, a previously established method for determining the relative apparent solubility of adapted for screening in small scale and which is reported to correlate with the Kd values obtained by DLS (Scannell et.al, Pharm Res 2021

This method, adapted in 96 well plate allow to compare monoclonal antibody (mAb) candidates also if only limited quantities (eg. 1 mg) are available. 

Protocol 

(for A280nm reading with Nanodrop or similar)

(adapted from Toprani et.al J Pharm Sci. 2016

Day1 (afternoon)

1) 25ul of monoclonal antibody at 1mg/ml mixed with 25ul of PEG10K solutions at different concentrations (from 32% to 8%) in a 96well V-bottom plate

                           Example of a plate assembled to test 6 different mabs in duplicate: 

2) The plate was covered by aluminum foil and incubated O/N at 4°C

Day2

3) The plate was centrifuged 1h at 3200g at 4°C; 

4)10ul of surnatant were carefully transferred in a 96 well PCR plate (using a multichannel pipette). V bottom plates are preferable since the form of the well reduce the probability to resuspend the precipitate during the surnatant pick-up;

5) Amount of mab present in the surnatant was quantified by measuring the A(280nm) by NanoDrop Spectrophotometer;

6) Relative soluble fraction is calculated and plotted as function of PEG concentration;

Example of results

Example 1

 Comparision of  PEG solubility for 3 different mabs  (human igG1-CLk) in PBS buffer


Example 2

Comparision of PEG solubility for 2 different mabs in 2 different buffers (different pH)


The main limit of this protocoll is represented by the throughput, since sample reading by nanodrop allow to scale down the protocol and reduce a lot the protein amount but it is not very fast. 

6 mabs in duplicate --> 96 well --> more than 1h at nanodrop

For high number of samples, you can run a modified verision of the protocol, based on A280 deterination using 96well half volume UV clear plates (Greiner cod. 675801) in a multiplate reader. 

Since, in multiwell reader, the A280nm value change in fuction of both, concentration and optical path (that is function of the sample volume)  in this case to obtain a good sensitivitty the reaction volume (step1) were doubled  (50ul of mab 1mg/l + 50ul of PEG solution) and after centrifugation 70ul of the surnatant were tranfered to the  UV-clear 96 plate for the A280 determination with the multiplate reader. 

6 mabs in duplicate --> 96 well --> 1-2 minutes

Example 3

Comparision of PEG solubility for a wild tipe mab vs some mutant in PBS 

A(280nm) measure with Biotek- cytation5 multiplate reader

Microplate reader vs nanodrop:

Pros:
 Throughput (A plate could be acquired in few minutes)

Cons: 
Double amout of material required: (0,4 mg vs 0,2mg of mab each coloum)
Cost of the plates (about 8 euro/plates

Materials: 

- PEG 10K (Alfa Aesar cod. B21955)
- 96 well V-bottom plates (Costar cod. 3897)
- 96 UV-clear half volume (Greiner cod. 675801 cost ~ 8 euro/plate)

Other references: 

https://www.americanlaboratory.com/media/20/Document/DLS-Microrheology.pdf


Wednesday, September 14, 2022

ProteoCool Pills#19: Pay attention to reverse GOI insertion in TOPO cloning

The TOPO cloning technology (compared with PIPE and standard cloning in ProteoCool n° 1 is a simply and fast cloning approach able to accommodate a wide range of PCR insert sizes.

TOPO technology enables inserts with compatible ends to be readily joined to the vector in 5 minutes, without the need for additional ligation steps.

In my experience in some cases, incorrect Gene insertion (reverse) may happen in a certain %  (in my expereince 40-50%) of the E.coli clones obtained from TOPO reaction: 

This problem could be generally overcame just by screening and sequencing a large number of colonies (at least 4-6 for each clone)

However is important to pay attention to it during the PCR colony screening and the following sequence check:

For example, PCR colony screening  (see ProteoCool n° 4 for more detail about it)  performed with primers those anneal in the vector backborne will be not able to differenziate clones with reverse insertion from the good ones. 

Since the regions of the TOPO vectors located around (just before and after) the GOI insertion sites are quite similar (especially in the case that the GOI is cloned in a plasmid that do not codify for any C- or N- terminal tag)  is possible that the reverse insertion cpuld be not revealed by a not expert users

Example of cloning of a C-terminal His-tagger GOI in pcdna 3.4 TOPO for recombinant protein expression in mammalian cells (eg Expi293 or ExpiCHO)

In this case primers in addition to the GOI annealing sequence have to contain a flag carryng:

- KOZAC sequence before ATG start codon (Forward primer); 

- codons codyfing for the His tag followed by 1 or 2 Stop codons;

The final expected sequence (in the GOI is inserted in the correct direction) will be:

 TGACCTCCATAGAAGACACCGGGACCGATCCAGCCTCCGGACTCTAGAGGATCGAACCCTTgccaccATG-GOI-HIStag-STOP -STOP -AAGGGTTCGATCCCTACCGGTTAGTAATGAGTTTGATATCTCGACAATCAACCTCTGG

In yellow --> The region of pcdna3.4 before the insertion,

In Green --> The region of pcdna 3.4 after the insertion; 

and the respective Aminoacid traslation will be:

DLHRRHRDRSSLRTLEDRTLATM-GOI-HisTag**KGSIPTG***V*YLDNQPL 

 where * indicates STOP CODONS

On the contrary in case that the GOI is inserted in the opposite direction the final sequence will be:

ATTTTGTAATCCAGAGGTTGATTGTCGAGATATCAAACTCATTACTAACCGGTAGGGATCGAACCCTTgccaccATG-GOI-HIStag-STOP-STOP-GGGAGGGGGAAAGCGAAAGTCCCGGAAAGGAGCTGACAGGTGGTGGCAATGCCC

and the respective Aminoacid traslation will be:

FVIQRLIVEISNSLLTGRDRTLATM-GOI-HISTag**KGSIL*SPEAGSVPVSSMEVKTAWM

Performing an allingment you can easly see how the insert flanking regions are really similar

therefore during the sequence check, the sequence analisys cannot be restricted to the few bases close to the insert but need to be extended at least to 10-20bp before and 15-20bp after the insert. 

The risk of this kind of mistake is higher in vectors as pcdna3.4 those do not codify for any additional N- or C-terminal tag. In a vector those codify for a TAG, in case of reverse PCR insertion, you will found the  AA sequence of the TAG traslated in the opposite direction respect than the sequence of the insert.

In case you have some clone produced using TOPO cloning and do not show any expression,, i suggest to you,  before re-design the cloning strategy, to perform a double sequence check to be sure that your gene was inserted in the correct direction. 


Wednesday, July 27, 2022

ProteoCool Pills#18: MabSelect@ a cheaper alternative to proteinA sepharose FF resin for small scale gravity flow purification of recombinant mab

Affinity chromatography which is based on the interaction the Fc region of the mAb molecule with  specifi bacterial proteins as proteinA, proteinG or protein L immobilized on the resin is generally used for the isolation of antibodies from culture surnantants of the cell lines (eg CHO) used for their recombinant production.

The binding specificity and strength of protein A, protein G and protein L is not equally strong for all immunoglobulins and, in the case of IgG, not equal for all isotypes (Link1, Link2)

A generally stronger binding to the Fc region is observed by protein G, however higher binding strength however does not automatically result in better results since also the presence of impurities may influence the binding capacity.

In both, protein A and protein G affinity chromatography, the elution is carried out using a low pH buffer (eg glicine pH 2,7 for proteinG, and citrate pH3,0 for protein A). Generally in protein G chromatography, a stronger eluent is required to elute the  captured antibody from the coloumn.

Thus, protein A chromatography is preferred over protein G since lower levels of impurities are generally obtained and it currently represent the gold standard in mAb pruficiation. 

In general an efficient protein A resin should have: 

- High dynamic binding capacity (able to bind large amounts of mAbs in a short time) which allow high flow-rate without losing mAbs in the flow-through

-  High stability of the resin under regeneration with sodium hydroxide. The number of cycles you can run with the same resin has a huge economic impact;

Often, in the preliminary phases of the pre-clinical research, to identify the best mabs, scientists have to a large panel of different mabs in small amount (from ug to mgs). In absence of robotic platforms dedicated to mab purification, the gravity flow purification may represent a simple and powerful alternative.   

Gravity flow purification require a resin with high porosity, rigidity and low backpressure to avoid resin clogging and guarantee reasonable flow-rate and purification timelines.

The Citivya rProteinA Fast flow resins  (90uM of particle diameter), which represent the gold standard for the gravity flow purification of recombinant monoclonal antibodies is very expensive  (more than 80euro/ml). 

If it is true that this resin could be cleaned and re-generated several time and that thanks to its high binding capability (>35mg/ml)  generally small volumes (100-500ul/sample) of resin are enough to purify mgs of mab samples requited in the preliminary mab screening phase i however its cost may have an high impact expecially in academic laboratories and the identification of an alternative resin with similar performances but low cost is preferable.

In this post i would like to share with you some enocuraging results that i have recently obtained with gravity flow purification by replacing the rprotA FF with the cheaper Mabselect resin which is reported to have 

- similar binding capability  (30mg/ml of Mabselect vs 35mg/ml of rproA FF)

and

- similar particle size  (85um of Mabselect vs 90um of rproA FF)

but it is at least 5 time cheaper (25ml of mabselect cost = 5ml of rprotA resin)


Mab Select resin tested in the 2 following  formats

format 1 (small)  --> 75ul of resin in a Poliprep coloum (Biorad cod. #731-550)

format2 (medium) --> 750ul of resin in a PD-10 empty coloumn  (GE cod. 17-0851-01)

showed flow rate very close to the FF (as you can see in the following videos: protA FF on the left, MAbselect on the right) 

Video 1: Equilibration with buffer


                                                 Video 2: Expi-CHO surnatant loading


and similar results in terms of binding capacity and final mab purity level

In the following picture, 2 examples of purification performed with the MabSelect resin

In both cases the following buffers were used: 


- Tris 2M pH=8 (1ml for 20ml culture) to correct the surnatant pH before coloumn loading;

- Equilibration and washing buffer; Tris 25mM, NaCl 25mM pH 7,2  buffer;

- Elution buffer: 300ul di Citrate 100mM NaCl 60mM pH=3;

- Tris 1M pH=9 (30ul for small size; 300ul for medium size) to neutralize the acid pH after elution


Of course there are many other interesting proteinA resins cheaper than the rProtA FF ND produded from suppliers different from Cytiva as  Tosoh. Biorad,  Thermo that could be also tested.

Personally, i selected the Mabselect since was the one with the particle size more close to the FF and i suspect that this detail can be essential to guarantee a good flow rare  in gravity flow purification. 

Friday, July 8, 2022

ProteoCool Pills#17: Alternative cheaper trasfection agents for recombinant protein/antibody expression with Expi293

 As already reported in the ProteoCool n° 29, Expi293 are a powerfull cell line those, thanks to their ability to growth up to very high cell density and be transfected with high efficiency are able to secrete in the surnatant high yields of recombinant proteins.

The main factor that currently limit the application of this system is certanilly the cost, since the volumetric cost (euro/liter of culture) is very high and comparable with the cost of a 13C/15N labelled sample in E.coli.

Cost of 30ml culture of Expi293 (updated to July 2022)

Components:

a) Expi293 expression medium (cod. A1435101 Thermo)  cost: 331euro (quotation 2022) --> 1 liter 

b) Expifectamine trasfection kit (cod. A14524 Thermo) cost:  1100 euro  (quotation 2022) --> For 1 liter

c) Cup vented Corning shaking flaks 125ml cod. 734-1885 (VWR quotation 2022) --> 8,8 euro/flask

d) DNA preparation  (EZNA mini kit II cod. D6945-02) 1 -> euro/1 sample – Thermo midi kit cod. K210004 cost 4euro/1sample)

Therefore the total cost of a 30ml tranfection 

 9,9(a)+ 33(b)+8,8(c)+1-4(d) = 50-55euro/flask  --> Around  1.800 euro/liter

and the tranfection reagent contribute to more than 50% of the costs (33 out of 55 euro)

Since the Expi293 become progressivelly more popular, several company develope alternative  tranfection agents that are suggested to be suitable for Expi 293.

In this post i briefly sgow you the results that i obtained by comparing;

- The standard Expifectamine 293 Transfection kit ;

- Endofectin Expi293 transfection kit;

- FectroPro transfection kit 

2 different expression trials in 2ml format (6 well plates)

Trial 1: 2 recombinant His-tagger protein; 
Trial2; 2 recombinant monoclonal antibodies)

 performed to compare the  producivity of the different trasferction agents;

In all cases the only reagents that are different are those part of the transfection kits
, while culture media (Expi293 culture media) and antibiotics, are the same 
alteady listed in ProteoCool n°29


Summary:

Those preliminary data suggest that both Endofectin Expi293 and Fectopro
 show performances close to the Expifectamin293  Thermo reagent with Expi293 cells

Of course the trails was performed with a limited number of protens and few replicates and more data need to be performed to confirm it, but it seems that the differences in protein/antibody productivity, if there are differences, are much less important than the difference in terms of costs.

The same comparision performed with the Expi-CHO kit was not successfull (data not shown) 
probably because the Endofectamine293 and Fectopro Kit do not contain any medium Feed
 which seems to be essential to allow the ExpiCHO cells to growth until high cell densities
  (trasfection with ExpiCHO is performed at 6*10^6 cells/ml vs 3*10^6 cells/ml used for the Expi293) and retain good viability during the entire trasfection(8 days).


ProteoCool37: Densitometric analisys of SDS-page using Image LAB software (license free version)

  A new video exploring how to optimize the densitometric analysis of SDS-PAGE gels using the basic version of Bio-Rad Image Lab is now avai...