Showing posts with label quantification. Show all posts

Monday, April 3, 2023

ProteoCool Pills#25: Choice of the right material is essential to perform DNA and/or protein UV Spectrophotometric quantifications

 As already reported in the ProteoCool Pills#13, and ProteoCool Pills #24 several different methods are currently available to perform quantification of purified DNA fragments and plasmid as well as recombinant proteins and antibodies.

One simple method common to both, DNA and protein quantification is the spectrophotometric determination in the UV range (260nm for DNA and RNA and 280nm for proteins and monoclonal antibodies)

Spectrophotometric quantification has several advantages:

 - Cheap (do not require any specific reagent);

-  Fast (do not require sample pre-incubations);

Non-destructive (the sample could be recovered);

The main drawback that limits in the past the use of the UV quantification was the fact that standard glass and standard plastic absorbs strongly in UV region and the quartz cuvettes were necessary to perform protein (280nm) and DNA (260nm) quantification.

Quarts cuvettes work well in both UV and visible regions (right from 190 nm) but are expensive, fragile and time consuming, because not disposable and therefore it need to be carefully washed between the different samples.

Of course the same limitation is applicable also to the multiplate reader, because the standard plastic bottom plates cannot be used for measurements in <300-320 nm due to the plastic absorbance.

Solutions:

1) Use a microvolume UV-Vis spectrophotometers (eg Nanodrop) that do not require any specific support (plate or cuvette):

  Pros:

 Low sample volume (2 µl)

 Fast

      Simple

       Cons:

          Less sensitive than cuvettes because the optical path is 1mm instead 10mM of the cuvettes

  Lambert-beer law à  Abs=ebc where b is the optical path

For the same sample e= constant à 1/10 of optical path à 1/10 of Abs at the same c (concentration)

 Need to be carefully cleaned (protein buffers are rich of salt and the surface properties of the pedestals can be compromised and the samples drop Flattens out and the read are not reproducible

       2) Use Plastic UV-Cuvette or  UVclear multiplates:

In the recent years special plastic compounds with low absorbance at wavelength >220nm were developed:

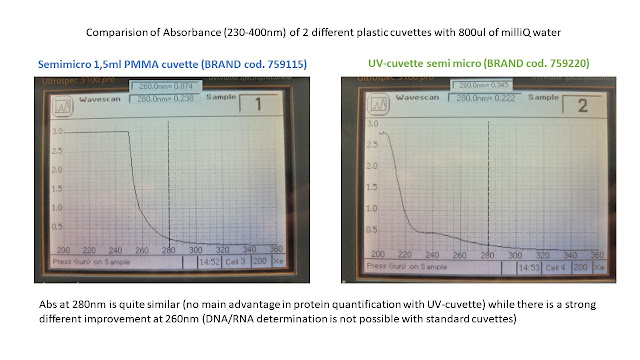
In this post I would like just to provide some example of comparision of background Abs260 and Abs280 signal obtained with standard and UV-transparent plastic matherial:


In conclusion, expecially for DNA determination, standard plastic cuvette and multiwell plates cannot be used. The UV transparent plastics represent a nice, cheaper alternative to quartz cuvette. If it is true that those support are little more expensive than the corresponding made by standard plastic matherial, it is also true that in the most of the cases, after carefull washing with milliQ water and ethanol20%  can be re-used many times. 


Thursday, March 9, 2023

ProteoCool pills#24: Rapid fluorimetric DNA plasmid quantification on 96 welll plate

One of the most common methods for nucleic acid detection and quantification is the measurement of solution absorbance at 260 nm (A260) due to the fact that nucleic acids have an absorption maximum at this UV wavelength

When DNA is present in the sample a fraction of the ultraviolet light will pass through and an other fraction will be absorbed and the amount of the light absorbed is directly proportional to the nucleic acid concentration in the sample. Using the Beer-Lambert Law it is possible to relate the amount of light absorbed to the concentration of the absorbing molecule.

At a wavelength of 260nm, the average extinction coefficient is:

-        0.020 (μg/ml)−1cm−1, double-stranded DNA;

-        0.027 (μg/ml)−1 cm−1, for single-stranded DNA 

Spectrophotometric quantification is precise and with the advent of microvolume spectrophotometer (e.g  nanodrop) those allow to perform measurement using very small sample volumes (1-2ul) with-out the use of any sample support (e.g quartz cuvette)  it become the method of first choice for DNA plasmid quantification in the molecular biology laboratories.

DNA quantification with microvolume spectrophotometer is precise and allow to evaluate DNA purity and RNA but it is time consuming  (20-30’’ for sample) and therefore not applicable to the measurement of a huge number of samples in parallel.

Modern HT (High throughput) cloning platforms produce hundreds of DNA samples (plasmidic ans/or genomic) in parallel and using a multiwell based approach is certainly preferable to speed up the process. 

Since multiwell determination require at least 50-100 ul of  sample/well,  a preliminary sample dilution step is required to do not use the entire DNA sample for this step, but this may represent a problem, since the method sensitivity is limited.

For example: 

- If we consider that A(260)=0.1 using a spectrophotometer with 1 cm of optical path-lenght correspond to a dna sample with concentration of 5ng/ul. 

Generally the path-length in a multiwell plates is lower than 1cm 

For example 100ul of an half area UVclear 96 well plate result on a path length of about 0,67cm  (A(260)=0,1 with a 7,5ng/ul sample)

Therefore if we dilute 10ul of our MINI PREP to 100ul final and we read the ABS280 on a multiplate reader we will obtain a  detectable ABS (>0,1) only for samples with concentration >75ng/ul that is too high since in my experience the range of plasmid concentrations that are generally obtained with a 96 well plate mini kit is in the range 20-100ng/ul. 

In this post I would like to show you as using a common Fluorimetric stains  (in my case Lonza Gel Star) developed to bind DNA staining in agarose gel a rapid DNA quantification could be performed in 96 well plate format. 

Example:

DNA plasmidic quantification using Gel Star probe (Lonza)

2ul DNA sample in 100ul Gelstar stain diluted 10000 times (1X final concentration) in H2O 

plates: 96 well flat black (Greiner)


Instrument: multiplate reader (Tecan M200)   Ex:490nm; Em:530mn (gain:80)

A standard curve was built using an available commercial plasmid pRSET/BFP (Invitrogen) and serial dilution were performed to obtain a final DNA concentration range (2,5- 0,0025ug/ml) 


The fluorimetric methods using GelStar show linearity in a concentration range 0,01ng/ul to 0,625ng/ul.

Therefore the methods, using 2ul of dna sample (dilute in 100 of probe) could be direclty applied to the quantification of DNA samples in concentration range 0,5-30 ng/ul that is in the range of the sample that normally are obtained for 96-well mini kit dna preparation kit.

In case that DNA samples are more concentrated we can simple reduce the DNA volumes  (to 1ul or 0,5ul) used for the test.

Considering that fluorescence of the probe can depend from DNA size and origin (single or double strand) is it ever suggested to perform a calibration line with a standard DNA sample with similar size and origin respect the ones that we would like to quantify.

Of course differently to 260/280 nm quantification this methods do not allow to you to estimate sample purifity )in terms of protiens) or buffer contamination but i'm my opinion modern mini kits are quite reilable and in 99% of cases the sample quality is ok for the downstream applications (eg sequencing, E.coli trasformation)

In my experience, this method is very usefull to rapid quantification of high number of purified plasmid to use for sequencing, trasformation and protein expression. 

I have done those trials with GelStar probe since it was the one avaialble in my lab at the time of this test but i suppose that similar results can be obtained also with other simiilar probes (eg, Gelred, midori green, Sybr safe it the right Ex/Em wavelenght were selected. Since each probe is chatacterized from a different fluoresence quantum yielad is possible that a different probe may affect a little the limit of sensitivity. 

Please, DO NOT USE Ethidium Bromide!!

Fortunatelly today,  less toxic probes (as i already mentioned in the ProteoCool Pills n°4) with similar sentitivity and low cost are avaialble. 


Thursday, September 30, 2021

ProteoCool Pills#13: Densitometric Protein quantification from SDS-page using the Image J free software package

 Several different methods are currently available to perform quantification of purified recombinant proteins and antibodies

There is not a best, universal method, the provide a reliable result for all the proteins;  

Each methods have it some prons and cons and its applicability depend from the intrinsic properties of the target protein.

For example:

UV quantification that exploits the properties of aromatic amino acids (tryptophan and tyrosines) to absorb energy around 280 nm is fast and require limited amount of sample but cannot be performed with proteins that do not contain aromatic amino acids or with buffers with an intrinsic absorbance in the UV regions.

Colorimetric-fluorimetric assays as Bradford, BCA, Nanoorange are susceptible to buffer compositions (eg BCA is not compatible with reducing agents) and to extrapolate quantitative results, the comparison with a  calibration line is required Results may change a lot on the basis of the protein that is used to build the calibration line (generally BSA) because different proteins may show different response in function of their aminoacidic composition or stability of their conformation in presence of the dye.

gg: Bradford assay is less sensitive to full length antibodies (igG) than BSA (see fig 2 page 6 ) and therefore in case you would like to use Bradford assay to quantify a monoclonal antibody (mab) a calibration with a commercial mab is required.

In some unlucky cases, for those proteins that do not contain hydrophobic amino acid and shows low response to colorimetric assay (due to strong conformational stability of presence of post translational modifications, eg hyper glycosylation) all the previous methods may not be reliable and densitometric analysis from SDS-page may represent a simple and cheap alternative.

Quantitative densitometry of proteins from SDS-page stained with colorimetric reagents (eg  coomassie blue) require a software to perform image processing,  extrapolate peak area and correlate it with the sample concentration.

To date most of the commercial gel documentation systems are supplied with their Image analysis Software able to perform band intensity determination.

However, if those Gel acquisition systems are still essential for acquisition of agarose gel images, high quality images of SDS-page gels stained with Coomassie can be obtained using modern smartphone those carrying high resolution camera.

ImageJ (NIH), a public domain program from the National Institutes of Health downloadable at https://imagej.nih.gov/ij/download.html can be used to analyse the SDS-page images.


1. Open the gel image

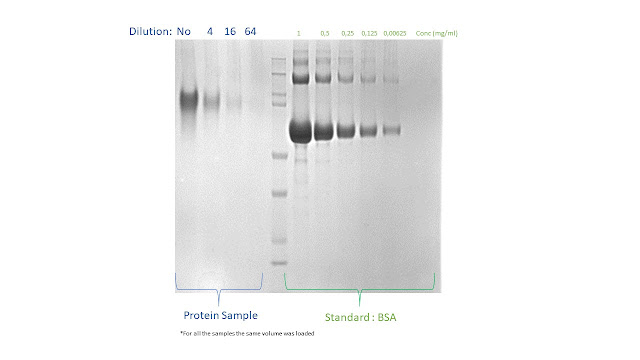
On the gel selected for this example, we load several dilutions of a purified protein sample with unknown concentration (to be determined) and several know amount of BSA required to build a reference calibration curve

2. Select rectangle in the AREA SELECTION TOOL
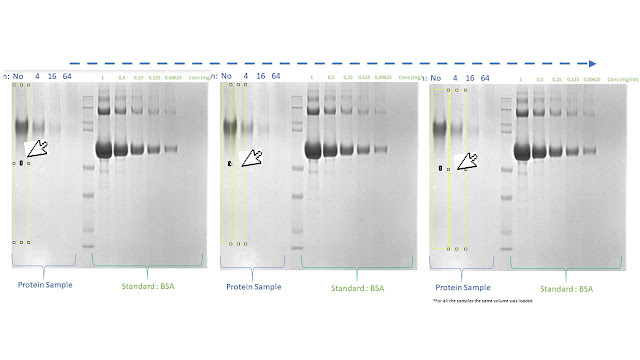
3. Choose the 1st  line, select the rectangle tool, and draw a box around the lane
making sure to include some of the empty gel between lanes and white space outside of the band. 
When creating the selection, drag with the shift key down to constrain it to a square.

4. Define the 1st  line: Go to Analyze→Gels→Select first lane

      5. Select the 2nd line

        Make sure your cursor shows as an arrow, grab the rectangle you just made, and drag it to the next lan

DO NOT DRAW NEW RECTANGLES! You must drag the same rectangle you just made because to compare the band you have to use the exact same size originally defined area in Lane 1.

6. Define the 2nd line: Go to Analyze→Gels→Select next lane


7.  Repeat the step 5 and 6 since all the line (sample and standard dilutions) are selected and numbered

 8. Go to Analyze→Gels→Plot lanes 


A new windows containing an histograms for each line will appear

9. Drag two fingers on the mousepad to scroll up and down and navigate the grids
The peaks in each grid correspond to the intensity of the bands in the lane

 10.   On the ImageJ interface, select the "line" button (red arrow) to define the peak baseline

     11. Draw a line at the bottom of the peak that represents the baseline of your peak and it allow to define the area of the curve.

12. Drag two fingers on the mousepad to scroll down and keep drawing all the single lines to define the curves in your standard and protein of interest lanes.
 

  13. Once you draw a baseline for each peak, on the ImageJ interface, select the "magic wand" button (red arrow)


 14. Click on the line defining the area of the curve of the first peak

 A "Results" window containing the measured area will appear

  15. Drag two fingers on the mousepad to scroll down and define the area of all peaks with the defined baseline

16. In the Result window Go to File→Save as

ans Save your Results in .csv format so that you can transfer the measurements to excel to generate the standard curve (linear regression analysis) and determine the concentration of your protein sample.

A Possible mistakes:

When you draw the peak baselines (point 10-12), the line has to interpolate bothfeetof each peak 

to correctly define and measure the peak area. 


The same analysis could be used to determine band intensity and extrapolate dna or rna quantification from agarose gel. 

However in my opinion the limited linear range of densitometric analysis and low reproducibility in gel load and coloration make this quantification approach not very precise and have to be applied only when better alternatives (as 280nm quantification for DNA) are not available.

Sunday, April 18, 2021

ProteoCool Pills#2: Homemade Bradford reagent 5X


TIPS of the Week #2

(18/04/2021)

Homemade Bradford reagent 5X 

(for 1 liter)

100mg Comassie Brilliant Blue G-250

dissolved in

-         48 ml of absolute EtOH

-         100 ml 85% (w/v) H3PO4


Mix well until the die is completely dissolved

Dilute up to 1liter with milliQ water and filter through a 0.45uM PDVF filtrer.

Store the dye at 4°C and use as 5X solution.


Cost for 1 liter:

-         Comassie G250 (Thermo cod. 20279 cost 144€/50g à 0,3€

-         EtOH (Sigma Aldrich cod. 51976 cost: 100€/500ml ~ 10€

-         H3PO4 (eg FisherScientific cod. 13207659 cost 48,2€/500ml ~ 4.8€


Total <20€ for 1 liter that is very low if you consider that

Biorad Protein Assay reagent 5X cod. 5000006 à 180€ for 500ml


ProteoCool Pills #32: HemA, a powerfull selection marker for antibiotic free plasmid mantainance for recombinant protein expression in E.coli

Antibiotic resistance genes  (e.g Ampicillin , Kanamycin ) are the most commonly used markers for plamisd selection in DNA production and r...