Several different methods are currently available to perform quantification of purified recombinant proteins and antibodies
There is
not a best, universal method, the provide a reliable result for all the
proteins;
Each
methods have it some prons and
cons and its applicability depend from the
intrinsic properties of the target protein.
For
example:
UV quantification that exploits the properties of aromatic amino
acids (tryptophan and tyrosines) to absorb
energy around 280 nm is fast and require limited amount of sample but cannot be
performed with proteins that do not contain aromatic amino acids or with
buffers with an intrinsic absorbance in the UV regions.
Colorimetric-fluorimetric assays as Bradford, BCA, Nanoorange are
susceptible to buffer compositions (eg BCA is not compatible with
reducing agents) and to extrapolate quantitative results, the comparison with a
calibration line is required Results may
change a lot on the basis of the protein that is used to build the calibration
line (generally BSA) because different proteins may show different response in
function of their aminoacidic composition or stability of their conformation in
presence of the dye.
gg: Bradford assay is less sensitive to full
length antibodies (igG) than BSA (see fig 2 page 6 ) and therefore in case you would like to use Bradford assay to
quantify a monoclonal antibody (mab) a calibration with a commercial mab is required.
In some
unlucky cases, for those proteins that do not contain hydrophobic amino acid
and shows low response to colorimetric assay (due to strong conformational
stability of presence of post translational modifications, eg hyper
glycosylation) all the previous methods may not be reliable and densitometric analysis
from SDS-page may represent a simple and cheap alternative.
Quantitative
densitometry of proteins from SDS-page stained with colorimetric reagents (eg coomassie blue) require a software to perform
image processing, extrapolate peak area
and correlate it with the sample concentration.
To date
most of the commercial gel documentation systems are supplied with their Image analysis
Software able to perform band intensity determination.
However, if
those Gel acquisition systems are still essential for acquisition of agarose
gel images, high quality images of SDS-page gels stained with Coomassie can be
obtained using modern smartphone those carrying high resolution camera.
ImageJ (NIH), a public domain program from the National Institutes of Health downloadable at https://imagej.nih.gov/ij/download.html can be used to analyse the SDS-page images.
1. Open the gel image
 On the gel
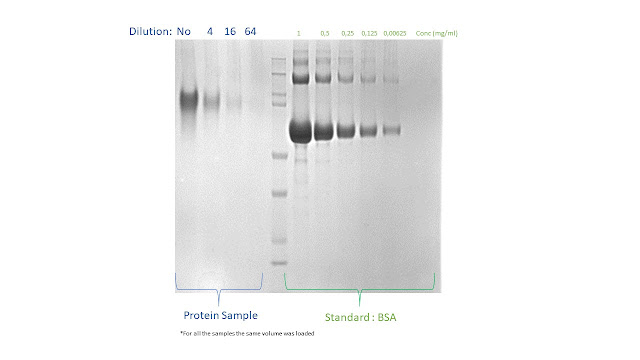
selected for this example, we load several dilutions of a purified protein
sample with unknown concentration (to be determined) and several know amount of
BSA required to build a reference calibration curve
On the gel
selected for this example, we load several dilutions of a purified protein
sample with unknown concentration (to be determined) and several know amount of
BSA required to build a reference calibration curve5. Select the 2nd line
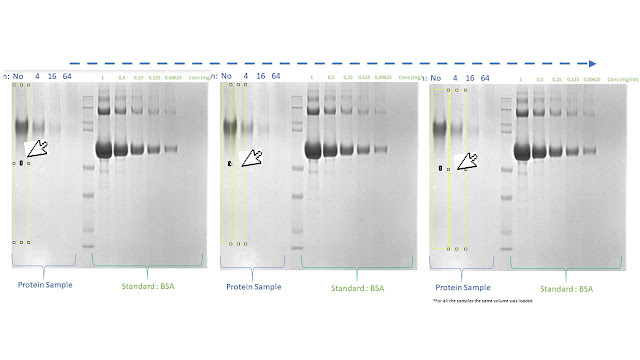
Make sure your cursor shows as an arrow, grab the rectangle you just made, and drag it to the next lan
DO NOT DRAW NEW RECTANGLES! You must drag the same rectangle you just made because to compare the band you have to use the exact same size originally defined area in Lane 1.
6. Define the 2nd line: Go to Analyze→Gels→Select
next lane
7. Repeat the step 5 and 6 since all the line (sample and standard dilutions) are selected and numbered
8. Go to Analyze→Gels→Plot
lanes
10. On the ImageJ interface, select the "line" button (red arrow) to define the peak baseline
11. Draw a line at the bottom
of the peak that represents the baseline of your peak and it allow to define
the area of the curve.
13. Once you draw a baseline for each
peak, on the ImageJ interface, select the "magic wand" button (red arrow)
14. Click on the line defining the area of the curve of the first peak
A "Results" window containing the measured area will appear
15. Drag two fingers on the mousepad to scroll down and define the area of all peaks with the defined baseline
16. In the Result window Go to File→Save as
A Possible mistakes:
When you draw the peak baselines
(point 10-12), the line has to interpolate both “feet” of each peak
to correctly define and measure the peak area.
However in my opinion the limited linear range of densitometric analysis and low reproducibility in gel load and coloration make this quantification approach not very precise and have to be applied only when better alternatives (as 280nm quantification for DNA) are not available.


No comments:
Post a Comment