Thursday, September 30, 2021

ProteoCool Pills#13: Densitometric Protein quantification from SDS-page using the Image J free software package

 Several different methods are currently available to perform quantification of purified recombinant proteins and antibodies

There is not a best, universal method, the provide a reliable result for all the proteins;  

Each methods have it some prons and cons and its applicability depend from the intrinsic properties of the target protein.

For example:

UV quantification that exploits the properties of aromatic amino acids (tryptophan and tyrosines) to absorb energy around 280 nm is fast and require limited amount of sample but cannot be performed with proteins that do not contain aromatic amino acids or with buffers with an intrinsic absorbance in the UV regions.

Colorimetric-fluorimetric assays as Bradford, BCA, Nanoorange are susceptible to buffer compositions (eg BCA is not compatible with reducing agents) and to extrapolate quantitative results, the comparison with a  calibration line is required Results may change a lot on the basis of the protein that is used to build the calibration line (generally BSA) because different proteins may show different response in function of their aminoacidic composition or stability of their conformation in presence of the dye.

gg: Bradford assay is less sensitive to full length antibodies (igG) than BSA (see fig 2 page 6 ) and therefore in case you would like to use Bradford assay to quantify a monoclonal antibody (mab) a calibration with a commercial mab is required.

In some unlucky cases, for those proteins that do not contain hydrophobic amino acid and shows low response to colorimetric assay (due to strong conformational stability of presence of post translational modifications, eg hyper glycosylation) all the previous methods may not be reliable and densitometric analysis from SDS-page may represent a simple and cheap alternative.

Quantitative densitometry of proteins from SDS-page stained with colorimetric reagents (eg  coomassie blue) require a software to perform image processing,  extrapolate peak area and correlate it with the sample concentration.

To date most of the commercial gel documentation systems are supplied with their Image analysis Software able to perform band intensity determination.

However, if those Gel acquisition systems are still essential for acquisition of agarose gel images, high quality images of SDS-page gels stained with Coomassie can be obtained using modern smartphone those carrying high resolution camera.

ImageJ (NIH), a public domain program from the National Institutes of Health downloadable at https://imagej.nih.gov/ij/download.html can be used to analyse the SDS-page images.


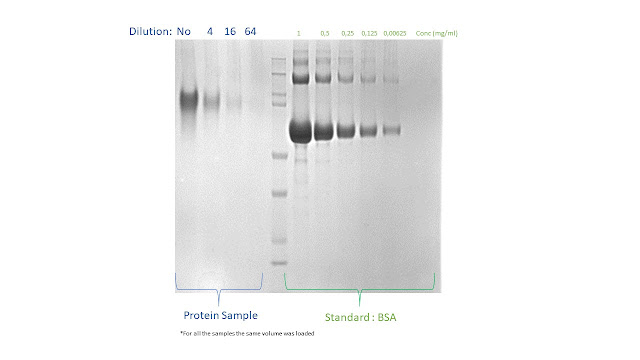
1. Open the gel image

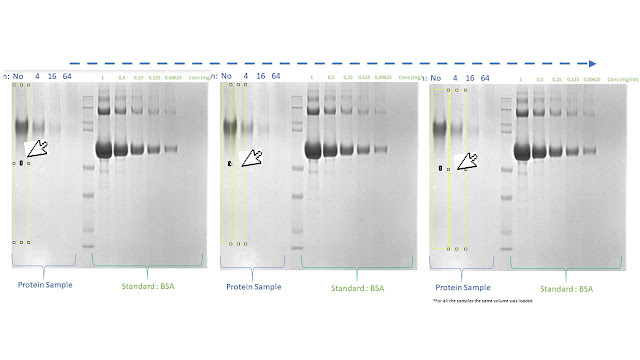
On the gel selected for this example, we load several dilutions of a purified protein sample with unknown concentration (to be determined) and several know amount of BSA required to build a reference calibration curve

2. Select rectangle in the AREA SELECTION TOOL
3. Choose the 1st  line, select the rectangle tool, and draw a box around the lane
making sure to include some of the empty gel between lanes and white space outside of the band. 
When creating the selection, drag with the shift key down to constrain it to a square.

4. Define the 1st  line: Go to Analyze→Gels→Select first lane

      5. Select the 2nd line

        Make sure your cursor shows as an arrow, grab the rectangle you just made, and drag it to the next lan

DO NOT DRAW NEW RECTANGLES! You must drag the same rectangle you just made because to compare the band you have to use the exact same size originally defined area in Lane 1.

6. Define the 2nd line: Go to Analyze→Gels→Select next lane


7.  Repeat the step 5 and 6 since all the line (sample and standard dilutions) are selected and numbered

 8. Go to Analyze→Gels→Plot lanes 


A new windows containing an histograms for each line will appear

9. Drag two fingers on the mousepad to scroll up and down and navigate the grids
The peaks in each grid correspond to the intensity of the bands in the lane

 10.   On the ImageJ interface, select the "line" button (red arrow) to define the peak baseline

     11. Draw a line at the bottom of the peak that represents the baseline of your peak and it allow to define the area of the curve.

12. Drag two fingers on the mousepad to scroll down and keep drawing all the single lines to define the curves in your standard and protein of interest lanes.
 

  13. Once you draw a baseline for each peak, on the ImageJ interface, select the "magic wand" button (red arrow)


 14. Click on the line defining the area of the curve of the first peak

 A "Results" window containing the measured area will appear

  15. Drag two fingers on the mousepad to scroll down and define the area of all peaks with the defined baseline

16. In the Result window Go to File→Save as

ans Save your Results in .csv format so that you can transfer the measurements to excel to generate the standard curve (linear regression analysis) and determine the concentration of your protein sample.

A Possible mistakes:

When you draw the peak baselines (point 10-12), the line has to interpolate bothfeetof each peak 

to correctly define and measure the peak area. 


The same analysis could be used to determine band intensity and extrapolate dna or rna quantification from agarose gel. 

However in my opinion the limited linear range of densitometric analysis and low reproducibility in gel load and coloration make this quantification approach not very precise and have to be applied only when better alternatives (as 280nm quantification for DNA) are not available.

Thursday, September 9, 2021

ProteoCool Pills#12: Rapid insertion/deletion/replacement of N-terminal signal peptide sequences using PIPE cloning

 In both eukaryotic and prokaryotic cells, all proteins are synthesized in cytoplasm. 

Proteins that are destined to enter into the secretory pathway are usually endowed with an N-terminal signal peptides (SPs, known also as N terminal leader sequences): the signal peptide those are short peptides and usually have a length of 16–30 amino acids.

After directing proteins to their specific locations, SPs are removed by signal peptidases

The presence or absence of the SPs allow to direct the expression of the protein in different cellular compartments:

- E.coli,  a protein with-out SPs will be directed in the cytoplasm, while the addiction of a SPs (as pelB, OmpA signal peptides) of the signal will  direct the protein into the periplasm;

-In Gram positive bacteria (as baccilus) and mammalian cells (as HEK293, CHO) the addiction of N terminal SPs direct the protein in the culture surnatant.

Since the accumulation of recombinant proteins in the cytoplasm may lead to the formation of inclusion bodies or protein degradation via proteases and the recombinant protein folding may also affected from the reducing conditions of the cell compartment (eg E.coli cytoplasm is strongly reducing and not compatible with S-S bond formation), the selection of the right Signal peptides play a decisive role in the industrial production of recombinant proteins.

It has been shown that using different homologous or heterologous signal peptides can affect the yields of recombinant proteins. Selecting a proper signal peptide to increase the secretion efficiency becomes a common methodology to optimize the production of recombinant protein

The availability of a simple cloning method to readily add, replace and modify a signal peptide sequences in an expression clone is therefore an essential tool to screen for the best protein/antibody productivity.

As already mentioned in the ProteoCool n°1: Cloning methods overview; The PIPE cloning is a nice method to manipulate expression vectors and perform mutagenesis, insertion and/or deletion or some vector regions.

With a single vector PCR is possible to insert dna fragments up to 80-100bp in any  vector region and therefore it can be applied also to the insertion of replacement of signal peptides in the vector of interest.


Using the PIPE cloning i  was able to insert pelB (MKYLLPTAAAGLLLLAAQPAMA)  and ompA (MKKTAIAIAVALAGFATVAQA) signal peptides in several pet15 clones for E.coli expression and other mammalian signal peptide in pcdna 3.4 clones for expression in Expi293 and Expi-CHO.

Of couse a similar approach could be performed to insert/delete or replace other short sequences as:

 - 6x His Tag
- Avi Tag
- Protease digestion sites (eg TEV, Eterokinase, Fatt.Xa)

or delete:
-N- or C- teminal region of your gene;
-N or C- terminal fusions (eg GFP, GST, MBP, etc)
----------------------------------------------------------------------------------------------------------------------------

PIPE cloning steps:

1) Vector amplification by PCR  (V-PCR)

2) PCR digestion with dpnI (to remove template vector background)

3) Trasfrom the vector into the MACH1 E.coli cells

4) Plasmid extraction from at least 4 colonies and DNA sequencing

-----------------------------------------------------------------------------------------------------------

                                            Tips to perform the Vector PCR:

PCR reaction:

My preferred DNA polymerases: Kapa Hifi (Roche) or Clone amp (Takara)

                       Theoretically you can use all high fidelity polimerases that do not add poly AA

DNA template --> less than 0.1ng/reaction 

(higher template amount may result in background colonies with the original template)

PCR volume --> 25ul/reaction are more than enough considering that for PIPE reaction 1-2ul are normally enough and PCR purification is not required.

PCR cycle:

Elongation time --> >1minute/kb also if the datasheet of the Taq suggest shorter extension time to exploit the 3-' --> 5' exonuclease activity that improve the formation of incomplete extension that are require for PIPE cloning.

Do not insert the final elongation time step.

---------------------------------------------------------------------------------------------------------------------------  

V-PCR trasfromation in E.coli cells (PIPE reaction)

PIPE cloning do not require PCR purification.

1)  Mix 2 ul of the V-PCR in 20ul of chemically competent MACH1 cells (thermo cod. )and incubate the mixture in ice 30 minutes;

N.B:  If the V-PCR band intensity is very high  (as in the reported picture)  yon can try also to dilute the plasmid 5 times and perform a second trasfromation with 2ul of the diluted plasmid in 20ul of cells because too much DNA can reduce the trasformation efficiency)

2) Incubate the cells 1' at 42°C

3) Transfer the cell in ice

4) Add 250ul of SOC or LB sterile media (with out antibiotic)

5) incubate the cells at 37°C - 180/600rpm (in a thermomixer or incubator shaker) 

6) Plate all the cells in LB-agar plates containing the proper selection antibiotic

(eg 100mg/l ampicillin for pet21 or pcdna 3.4,  50mg/l of kanamicin for pet24 clones)

7) incubate the plates O/N at 37°C

Primers design

Annealing regions à 18-26bp with an annealing temperature salt adjusted (calculated with Oligocalculator)  of 58-62°C if is possible)

Flanking regions –> length up to 60bp. Overlapping regions have to be between 15 and 20bp

Is not mandatory to add flanking regions in both forward and reverse primer to create the 16bp overlapping. It can be done also adding the flanking region in just 1 of the 2 primers. I choose one or the other solution on the basis of the length and Tm of the relative annealing regions.

----------------------------------------------------------------------------------------------------------------------------------------------------                                                                                      A great thanks to  

Roberto Petracca

an amazing supervisor who introduced me to the PIPE cloning

i was very lucky to shave with him many years in the Novartis Reseach centre in Siena 

References: 

Klock HE, Lesley SA. The Polymerase Incomplete Primer Extension (PIPE) method applied to high-throughput cloning and site-directed mutagenesis. Methods Mol Biol. 2009;498:91-103.


usefull links #1

i would like with share the folliwng 3 links about usefull on line tool for the scientist working with recombinant monoclonal antibodies:   ...